I installed 3.1.7 and there seems to be something quite wrong with the graphing function in the Session tab. My beer has an OG of 1.052 but the SG scale has a range which begins with 1.100 rather than my OG or anything like it. Why is this happening? Have reverted to 3.0 in view of this bug.
Session graphing problem
- Thread starter ivars
- Start date
BOB357
Grandmaster Brewer
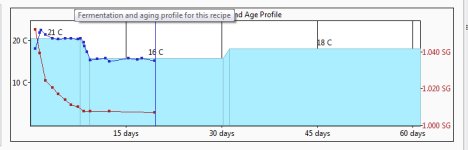
The only graph on the session page is the fermentation and age graph at the bottom, and I believe it auto ranges according to the settings in your fermentation profile. The other box at the bottom is for Tilt hydrometer data. Not sure what you're looking at, but I have used BeerSmith since ver. 1.xx and currently have ver. 3.1.05 and have never seen any other graph on the session page.
Thank you for your reply. I am talking about the fermentation graph which tracks temperature and density over time. I was wondering if anyone else had had an issue with the auto ranging of the density scale which is not responding appropriately to my fermentation profile. It seems I am alone with this problem and will stay with 3.0 as I don't have time to deal with the problem.
Yep: fermentation temperature and density over time.jomebrew said:I've had beersmith for many years. I have to say, there's a graph?
Attachments
- Joined
- Nov 6, 2010
- Messages
- 1,063
- Reaction score
- 11
I see. Not something I look at as I don't use but looking at it and adding my starting (not sure why that isn't added by default) asn see the range of the scale is 1.000 to 1.100.
I get that you want the top Y-Axis to be the starting gravity but the chart just uses 1.100 as the top. I verified if your starting gravity is higher that 1.100, the Y-Axis range is some value higher that your starting gravity.
This is likely for a visual of the gravity change in the middle of the graph.
I could find not way to change the Y-Axis peak value.
BierHaus
Apprentice
Create a custom fermentation profile. Then add that profile to the recipe design. The graph will scale to fit that profile.
BierHaus said:Create a custom fermentation profile. Then add that profile to the recipe design. The graph will scale to fit that profile.
I do not believe that is the case. I only use custom fermentation profiles. Whilst they scale appropriately in v3.0 they do not in v3.1. From memory older recipes when opened in 3.1 do have appropriate scales, my latest one did not. I any event, since 3.0 does what I need and I don't have time to mess around with what seems to be a bug, I have reverted to that version.